Technical SEO
SaaS SEO Metrics Pipeline Architecture: Ingesting GSC and GA4 at Scale
Introduction: Why SaaS Search Analytics Must Move to the Data Warehouse
For enterprise B2B SaaS organizations managing tens of thousands of programmatic landing pages, integration directories, and technical documentation hubs, standard web-based search console interfaces present severe operational constraints. Default reporting dashboards sample high-volume query distributions, truncate long-tail keyword visibility, and isolate search performance from down-funnel customer lifetime value.
Because the native Search Console web interface retains performance data for a maximum rolling window of 16 months as documented in the Google Search Central Search Analytics Documentation, enterprise SaaS businesses must warehouse their own historical search records to conduct multi-year cohort and algorithm update impact analyses.
For a site such as RankPulse, a warehouse-native search metrics pipeline could store aggregated daily search performance rows, track granular SERP position distributions, and connect organic landing-page metrics with downstream signup or subscription data.
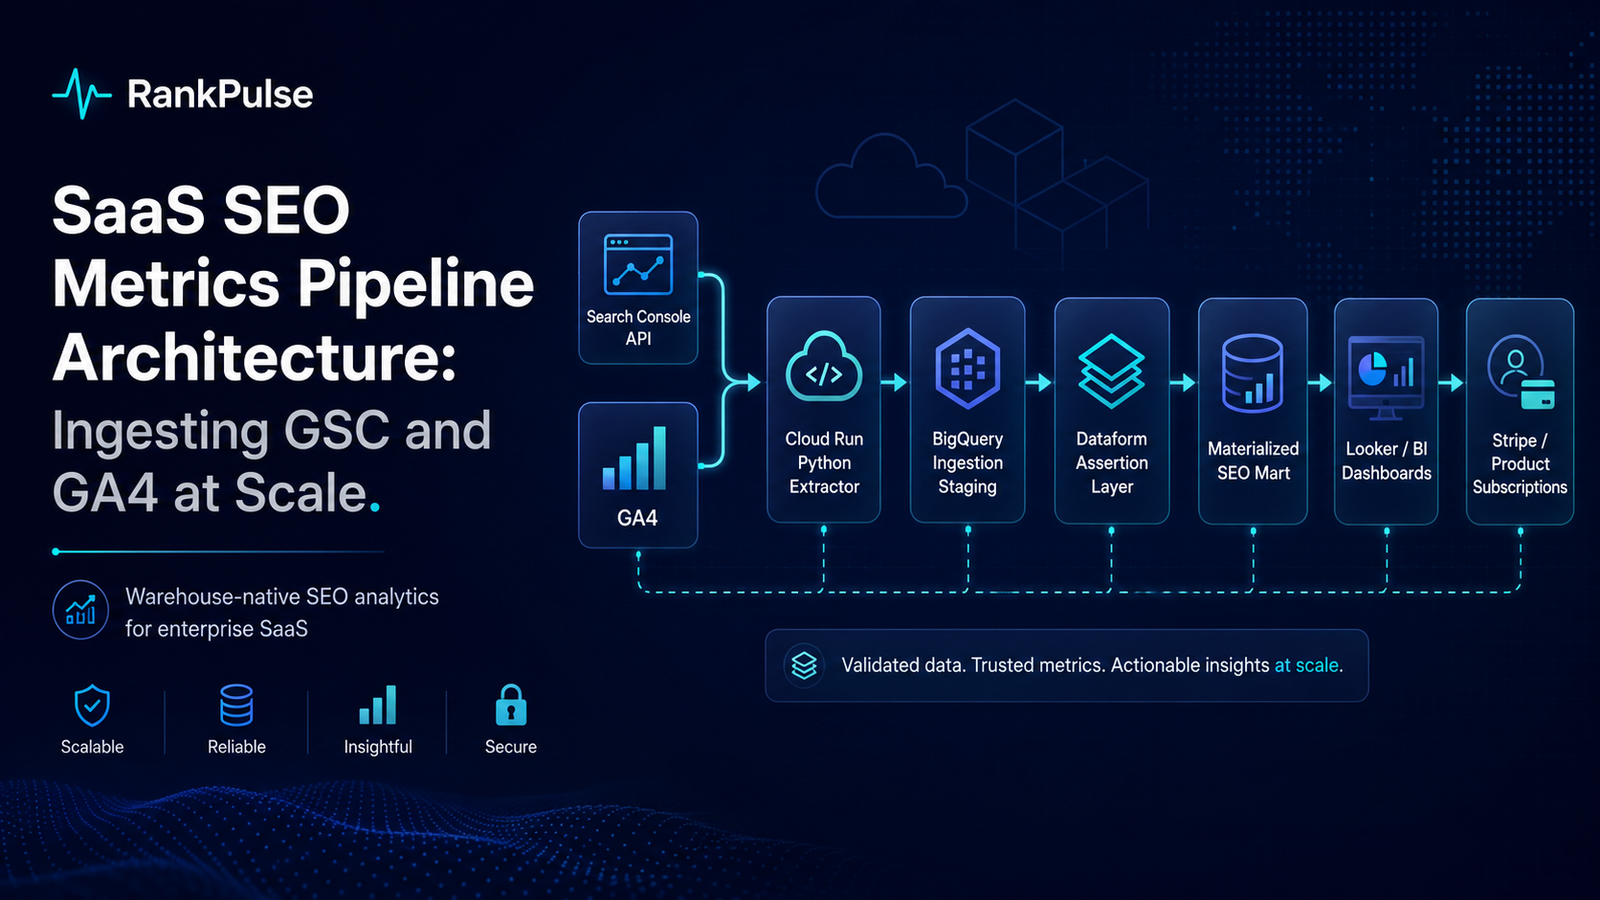
+---------------------------------------------------------------------------------------------------+
|                         ENTERPRISE SAAS SEARCH DATA PIPELINE ARCHITECTURE                         |
|                                                                                                   |
|  [Google Search Console API] ---> [Cloud Run Python Extractor] ---> [BigQuery Ingestion Staging]  |
|                                            |                                      |               |
|  [GA4 Measurement Protocol]   -------------+                                      v               |
|                                                                       [Dataform Assertion Layer]  |
|  [Stripe / Product Subscriptions] ----------------------------->                  |               |
|                                                                                   v               |
|                                                                       [Materialized SEO Mart]     |
|                                                                                   |               |
|                                                                                   v               |
|                                                                       [Looker / BI Dashboards]    |
+---------------------------------------------------------------------------------------------------+
Extracting Search Telemetry: GSC API Pagination and Dimension Chunking
Extracting a larger programmatic set of Search Console performance data requires using the Search Analytics API. It is important to frame what that endpoint returns: a Search Analytics query returns the top rows for the requested dimensions and date range, ordered by clicks, up to the requested row limit. It is not an unlimited exhaustive raw export, and Google does not guarantee that every underlying data row is returned.
According to the official Google Search Console API Reference, the Search Analytics query endpoint accepts a rowLimit whose valid range is 1–25,000 rows per request (default 1,000), and paginates with startRow, documented as a zero-based index of the first row in the response (default 0). A client should therefore validate rowLimit within 1–25,000 and reject a negative startRow before issuing a request, rather than relying on the API to reject an out-of-range value. The same reference documents that startDate and endDate are given in YYYY-MM-DD form and interpreted in PT, so a pipeline that partitions by calendar day must apply Search Console's own Search Analytics date semantics rather than assuming the warehouse's local timezone.
To improve coverage and manage large result sets, extraction jobs can partition requests by date and appropriate dimensions such as country, device, and URL subdirectory, while recognizing that Search Console still does not guarantee every underlying row.
To ensure continuous unattended extraction without manual user intervention, automated ingestion workers implement OAuth 2.0 refresh token exchanges conforming to IETF RFC 6749, exchanging long-lived refresh tokens for short-lived access credentials prior to API expiration.
When handling API rate limits during bulk data extraction, worker daemons interpret HTTP response status 429 Too Many Requests according to IETF RFC 6585 and honor standard Retry-After headers under IETF RFC 9110. RFC 9110 permits Retry-After to carry either delay-seconds or an HTTP-date, so a client must handle both forms: treat an integer as a second count, and convert an HTTP-date into the remaining seconds until that timestamp, clamping a past date to zero. A header that parses as neither should fall back to the job's bounded exponential backoff rather than aborting the extraction loop.
The following examples illustrate one possible architecture and are not a claim about RankPulse's current production infrastructure. The Python script below demonstrates how to execute paginated extractions across daily date partitions with automated error handling and rate-limit backoff:
# gsc_pipeline_extractor.py
import logging
import time
from datetime import datetime, timezone
from email.utils import parsedate_to_datetime
from typing import Any, Dict, List, Optional

from googleapiclient.errors import HttpError

logger = logging.getLogger("rankpulse.pipeline")

ROW_LIMIT_MIN = 1
ROW_LIMIT_MAX = 25_000          # documented Search Analytics maximum
RETRYABLE_STATUS = {429, 500, 502, 503, 504}
MAX_BACKOFF_SECONDS = 300


def parse_retry_after(value: Optional[str], fallback_seconds: int) -> int:
    """Resolve a Retry-After header to a non-negative delay in seconds.

    RFC 9110 allows either form, so both are handled:
      * delay-seconds  — a non-negative integer number of seconds;
      * HTTP-date      — an absolute timestamp, parsed with
                         email.utils.parsedate_to_datetime.

    A date already in the past yields 0 rather than a negative delay. Anything
    unparseable returns the caller's bounded exponential-backoff fallback: a
    malformed header must not take down the extraction loop.
    """
    if value is None:
        return fallback_seconds
    raw = value.strip()
    if not raw:
        return fallback_seconds

    # form 1: delay-seconds
    try:
        return max(0, int(raw))
    except ValueError:
        pass

    # form 2: HTTP-date
    try:
        when = parsedate_to_datetime(raw)
    except (TypeError, ValueError):
        return fallback_seconds
    if when is None:
        return fallback_seconds
    if when.tzinfo is None:                       # HTTP-dates are GMT
        when = when.replace(tzinfo=timezone.utc)
    delta = (when - datetime.now(timezone.utc)).total_seconds()
    return max(0, int(delta))


def extract_search_analytics_partition(
    service,
    site_url: str,
    target_date: str,
    start_row: int = 0,
    row_limit: int = ROW_LIMIT_MAX,
    max_retries: int = 5,
) -> List[Dict[str, Any]]:
    """Fetch one paginated page of Search Analytics rows for a single day.

    Dates are passed through to the API in YYYY-MM-DD form and are interpreted
    using Search Console's Search Analytics date semantics (PT), not the
    warehouse timezone. The response contains the top rows for the requested
    dimensions, not an exhaustive export.
    """
    if not ROW_LIMIT_MIN <= row_limit <= ROW_LIMIT_MAX:
        raise ValueError(
            f"rowLimit must be between {ROW_LIMIT_MIN} and {ROW_LIMIT_MAX}, got {row_limit}"
        )
    if start_row < 0:
        raise ValueError(f"startRow must be non-negative, got {start_row}")

    request_body = {
        "startDate": target_date,
        "endDate": target_date,
        "dimensions": ["date", "query", "page", "device", "country"],
        "rowLimit": row_limit,
        "startRow": start_row,
        "dataState": "final",
    }

    for attempt in range(1, max_retries + 1):
        try:
            response = (
                service.searchanalytics()
                .query(siteUrl=site_url, body=request_body)
                .execute()
            )
        except HttpError as exc:
            status = getattr(exc.resp, "status", None)
            if status not in RETRYABLE_STATUS:
                # Only the statuses this job selected as transient are retried.
                # Every other HttpError is re-raised so the caller decides, rather
                # than this loop asserting a blanket rule about all 4xx responses.
                logger.error(
                    "GSC query returned non-retried HTTP %s for %s on %s",
                    status, site_url, target_date,
                )
                raise
            if attempt == max_retries:
                raise
            backoff = min(2 ** attempt, MAX_BACKOFF_SECONDS)
            header = exc.resp.get("retry-after") if exc.resp else None
            wait_seconds = min(
                parse_retry_after(header, fallback_seconds=backoff),
                MAX_BACKOFF_SECONDS,
            )
            logger.warning(
                "GSC query transient HTTP %s (attempt %d/%d); retrying in %ds",
                status, attempt, max_retries, wait_seconds,
            )
            time.sleep(wait_seconds)
            continue

        rows = response.get("rows", [])
        logger.info(
            "Fetched %d rows for %s (startRow=%d)", len(rows), target_date, start_row
        )
        return rows

    raise RuntimeError(
        f"GSC extraction exhausted {max_retries} retries for {site_url} on {target_date}"
    )
Warehouse Storage Design: BigQuery Partitioning and Clustering Strategy
Once raw search records are extracted in JSON format, they are staged and ingested into columnar analytical warehouse tables. High-growth SaaS domains generate millions of search impression rows monthly. Storing these records in unpartitioned tables creates massive compute overhead and degrades daily dashboard query performance.
The DDL below uses PARTITION BY harvest_date, which is time-unit column partitioning on a DATE column — not ingestion-time partitioning. The Google Cloud BigQuery Partitioned Tables Guide distinguishes the two: a time-unit column partitioned table is partitioned on a DATE, TIMESTAMP or DATETIME column in the table, whereas an ingestion-time partitioned table assigns rows to partitions by when BigQuery ingested them. The distinction matters operationally, because only the column-partitioned form lets a query prune on the article's own harvest_date value. When a query filters on the partitioning column, BigQuery can prune partitions it does not need to read; setting require_partition_filter = TRUE makes that filter mandatory so an unfiltered full-table scan is rejected rather than silently executed.
According to the Google Cloud BigQuery Clustered Tables Guide, clustering by country_code, device_type and page_url co-locates related rows within storage blocks, which can let BigQuery skip blocks that cannot match a filter. The reduction in scanned data is a function of how well a given query's filters align with the partitioning column and the clustering column order; it is not a guaranteed speed-up, and a query that filters on none of those columns gains nothing from either setting. Treat both as configuration that enables pruning for aligned queries rather than as a blanket performance improvement.
-- DDL for Enterprise Search Console Analytics Staging in BigQuery
CREATE OR REPLACE TABLE `search_analytics_production.gsc_search_performance_staging`
(
    harvest_date DATE NOT NULL,
    query_string STRING NOT NULL,
    page_url STRING NOT NULL,
    device_type STRING NOT NULL,
    country_code STRING NOT NULL,
    impressions INT64 NOT NULL,
    clicks INT64 NOT NULL,
    click_through_rate FLOAT64 NOT NULL,
    average_position FLOAT64 NOT NULL,
    ingested_at TIMESTAMP NOT NULL
)
PARTITION BY harvest_date
CLUSTER BY country_code, device_type, page_url
OPTIONS (
    description = "Daily partitioned GSC search analytics telemetry table",
    require_partition_filter = TRUE
);
Server-Side Telemetry: GA4 Measurement Protocol Integration
To correlate organic landing page discovery with down-funnel trial activations and paying customer conversions, server-side telemetry must be captured in parallel with Search Console data.
In accordance with the Google Analytics 4 Measurement Protocol Reference, a request for a web data stream is identified by the measurement_id passed in the request URL, alongside an api_secret that is generated in the Google Analytics interface and must stay server-side — it is a credential and does not belong in browser-delivered code. The client_id identifying the user instance belongs in the JSON body, and the events themselves are carried in the body's events array.
Capturing trial signups via server-side Measurement Protocol event collection allows teams to record eligible backend subscription events without relying exclusively on client-side browser requests that may be blocked by user privacy extensions. Two caveats belong with that benefit. First, a 2xx response indicates the request was accepted for processing; it is not proof that every event and every parameter was accepted into reporting, so payloads should be validated during development and reconciled against reports rather than trusted on status code alone. Second, Measurement Protocol complements the wider GA4 collection strategy — it does not automatically replace client-side tagging, and sending the same conversion from both sides without deduplication will double-count it.
The endpoint shape is shown below with a placeholder credential; a real api_secret should be read from server-side secret storage and never committed or exposed to a client.
POST https://www.google-analytics.com/mp/collect?measurement_id=G-XXXXXXXXXX&api_secret=$GA4_API_SECRET
Content-Type: application/json
{
"client_id": "8472910394.1708492001",
"events": [
{
"name": "saas_trial_activated",
"params": {
"landing_page": "https://rankpulse.net/blog/saas-seo-metrics-pipeline-architecture-ingesting-gsc-and-ga4-at-scale",
"lead_tier": "enterprise",
"plan_type": "annual_pro",
"subscription_value_usd": 3600.0,
"currency": "USD"
}
}
]
}Data Governance: Automated Dataform Integrity Assertions
Unmonitored data ingestion pipelines frequently propagate corrupted records, duplicate offsets, and null keys downstream to executive reporting interfaces.
As outlined in the Google Cloud Dataform Assertions Guide, an assertion is a SQL query written to return the offending rows: it passes when it returns zero rows and fails when it returns any. Gating is not automatic simply because another action happens to reference the asserted table — downstream blocking depends on the relevant assertion being included in that action's dependency graph, so the dependency must actually be declared or the assertion configured to be depended upon. An assertion that runs but is not wired into the graph will report a failure without preventing the downstream table from being built.
Note the lower bound on average_position in the example. Search Console reports average position as a 1-based ranking — per the Search Console performance report metric definitions, position 1 is the topmost position, 2 is the next, and so on — so any value below 1.0 is invalid for this calculated metric. This is distinct from bulk-export internals such as the zero-based sum_top_position field; the column asserted here stores the calculated Search Analytics average_position metric.
-- dataform_definitions/assert_gsc_daily_integrity.sqlx
config {
    type: "assertion",
    description: "Returns offending rows only; passes when it returns zero rows"
}

SELECT
    harvest_date,
    query_string,
    page_url
FROM
    ${ref("gsc_search_performance_staging")}
WHERE
    harvest_date IS NULL
    OR query_string IS NULL
    OR page_url IS NULL
    OR impressions < 0
    OR clicks < 0
    OR clicks > impressions          -- a click without an impression is impossible
    OR click_through_rate < 0.0
    OR click_through_rate > 1.0
    OR average_position < 1.0;       -- Search Console average position is 1-based
Business Intelligence Acceleration: Materialized Summary Marts
According to the Google Cloud BigQuery Performance Overview Documentation, executing interactive BI dashboard queries directly against high-cardinality raw event logs causes significant query latency and excessive data scanning costs, which data engineering teams mitigate by pre-computing aggregated daily summary marts.
As established in the Google Cloud BigQuery BI Engine Reference, memory-accelerated BI caching delivers sub-second response times for dashboard analytical queries when data models leverage structured daily rollups.
-- DDL for Pre-Aggregated Daily Search Intelligence Mart
CREATE OR REPLACE TABLE `search_analytics_production.daily_seo_performance_mart`
PARTITION BY report_date
CLUSTER BY url_directory, device_type AS
SELECT
    harvest_date AS report_date,
    REGEXP_EXTRACT(page_url, r'^https?://[^/]+(/[^/]+/)') AS url_directory,
    device_type,
    country_code,
    COUNT(DISTINCT query_string) AS queries_receiving_impressions,
    SUM(impressions) AS total_impressions,
    SUM(clicks) AS total_clicks,
    SAFE_DIVIDE(SUM(clicks), SUM(impressions)) AS aggregate_ctr,
    SAFE_DIVIDE(SUM(average_position * impressions), SUM(impressions)) AS weighted_avg_position
FROM
    `search_analytics_production.gsc_search_performance_staging`
WHERE
    harvest_date >= DATE_SUB(CURRENT_DATE(), INTERVAL 60 DAY)
GROUP BY
    1, 2, 3, 4;
Summary of Data Pipeline Best Practices
- Enforce Rate Limits & Pagination: Implement chunked date extraction adhering to the 25,000-row GSC API ceiling.
- Partition Warehouse Tables: Partition BigQuery staging tables by
harvest_dateand filter on that partitioning column so BigQuery can prune irrelevant date partitions. - Capture Server-Side Conversions: Stream backend trial signups via GA4 Measurement Protocol endpoints.
- Automate Data Assertions: Block corrupted and malformed data from reaching executive reports using configured Dataform dependencies.
- Accelerate BI Queries: Build pre-aggregated daily summary marts so BI Engine can serve dashboard queries from structured daily rollups rather than scanning raw event logs.